Crude Oil Front Month
$91.38
CLX6 (CL1) · Nov 2026 · -1.57%
Brent Oil Front Month
$102.88
BZZ6 (CO1) · +0.63%
Natural Gas
$3.039
NGX26 (NG/USD) · +3.11%
WTI M1-M2
+$2.03
CL1/CL2 · CLX6/CLZ6 backwardation · +$0.03 1d
US crude w/w
+0.9M bbl
Sep 18 to Sep 25 Commercial stocks
Next EIA
4d 18h 25m
Wed 10:30 ET
Enerlytics state
No Edge
BNO · 1-5 days
Live market context
Last updated Oct 2, 3:54 PM
Energy decision intelligence

Build the case. Test the evidence. Know what breaks the thesis.

Enerlytics turns price, futures curves, physical balances, shipping, positioning, and news into one explainable workflow for crude oil and natural gas.

No black-box promises. Every signal is timestamped, explained, and evaluated after the market moves.

Observe

Start with the move, the curve, and the catalyst instead of a disconnected headline or quote.

Confirm

Test the story against inventories, storage, flows, freight, weather, and positioning.

Decide

Form a time-bound thesis with supporting evidence, contradictions, and clear invalidation.

Live signal preview

Brent Oil Fund (BNO) Signal

BNO is No Edge over 1-5 days: the model is not forcing a directional call.

No Edge
State
No Edge
Confidence
<0.1% · 0%
Forecast horizon
1-5 days
Updated
Oct 2, 6:30 AM
What is confirming
Hormuz friction
0.0%

Route friction can add supply timing risk, especially when price and structure are already firm.

Oil-news imbalance
-0.04

Compares bullish and bearish oil-impact news pressure in the recent headline set.

Chokepoint-news share
3.0%

Flags whether shipping or chokepoint headlines are becoming a meaningful part of the oil-news mix.

What could invalidate it
  • The directional lean keeps flipping or remains pinned near the threshold.
  • Feature coverage stays thin or recent resolved outcomes remain weak.
Previous evaluated result
Miss
1d
+4.7%
Watchlist · reliability-adjusted confidence 0%
No black-box promises. Signals stay timestamped, explained, and reviewed after the horizon resolves.
The Enerlytics decision loop

A trader's question comes first. The screens support the answer.

Start with what changed, test whether the curve and physical market agree, check who is carrying the position, then create a thesis that can strengthen, weaken, or fail as new evidence arrives.

01
Observe

What changed?

See the live move and identify the catalyst before forming a directional story.

Market PulseNews
02
Read structure

Is the curve agreeing?

Compare M1-M2 and M1-M6 history to separate prompt tightening from a broader curve move.

Curve History
03
Confirm physical

Are barrels or molecules confirming it?

Test the narrative against stocks, storage, production, refining, flows, freight, LNG, and weather.

EIA WeeklyCrude on WaterFreight & Shipping
04
Check participation

Is positioning supportive or crowded?

Use managed-money exposure as persistence and crowding context—not as a standalone timing signal.

CFTC Managed Money
05
Manage the thesis

What confirms or invalidates the case?

Track a time-bound thesis as evidence changes, with contradictions and readiness kept visible.

Market Thesis EngineModel SignalAlerts
The output is not simply “bullish” or “bearish.”

Enerlytics shows what is confirming, what is contradicting, what remains missing, and what would invalidate the current market thesis.

Open the workflow
30-day free trial

Create an account and open the live energy workflow.

30 days free, then $99/month. Cancel anytime. We will send a secure verification email so you can confirm your account and continue.

Start 30-day free trial

30 days free, then $99/month. Cancel anytime. Verify your email, then open the crude signal workflow.

30-day trial
If the confirmation email does not appear right away, check spam or junk as well.

By joining, you agree to receive product emails. Unsubscribe anytime.

Workflow proof by market

One decision process. Commodity-specific evidence.

Crude oil and natural gas should not be interpreted with identical shortcuts. Each workflow uses the evidence that actually governs that market, then brings it into the same confirmation framework.

The homepage shows the coverage. The full histories, comparisons, filters, and charts stay inside the dashboard.

Open the full market workflow
Crude oil
WTI + Brent
In dashboard
  • Observe: WTI, Brent, news, and prompt price action
  • Structure: M1-M2 and M1-M6 Curve History
  • Physical: EIA stocks, Cushing/PADD, refining, trade, and crude on water
  • Participation: CFTC Managed Money and tanker freight
  • Decision: Market Thesis Engine confirmation, contradiction, and invalidation
Natural gas
Henry Hub + LNG
In dashboard
  • Observe: Henry Hub, gas news, weather revisions, and catalysts
  • Structure: season-aware M1-M2 and M1-M6 Curve History
  • Physical: EIA storage, production, demand, LNG, and pipeline trade
  • Participation: CFTC Managed Money and LNG shipping
  • Decision: Natural-gas Market Thesis Engine evidence and invalidation
Live product preview

Keep the live market pulse, news flow, and AIS context in view.

The homepage should still prove the app is alive. These are the real live components from inside Enerlytics, not static marketing mockups pretending to be a workflow.

Market Pulse

Live · indicative
US Market Crude Stocks — 5Y Bands
Loading…
Market-facing U.S. crude stock series for balance work. SPR barrels are tracked separately. Values are shown in thousand barrels.
Official References

Matching Commercial crude stocks (WCESTUS1) and SPR crude stocks (WCSSTUS1) to the official EIA weekly release. Total is shown as the official EIA total when loaded, otherwise as commercial plus SPR context.

InsightLoading live inventory insight…
Crude on Water — Global
NOAA Historical•Real-Time AIS
Loading…
Global crude-on-water now tracks the monitored export and transit lanes directly: Atlantic supply, Middle East export, Red Sea transit, and Asia transit.
InsightLoading live crude-on-water insight…
Free education

Learn the market before you trade the signal.

Enerlytics is not just a dashboard. It is a workflow for understanding crude oil, natural gas, inventories, tanker flows, futures curves, and whether a market move is actually confirmed.

Crude oil and natural gas basics

Learn what actually moves energy markets: supply, demand, inventories, production, exports, imports, weather, refinery demand, and geopolitical risk.

Start learning

Price moved — but is it confirmed?

A headline can explain why oil moved. Enerlytics teaches you how to check whether inventories, spreads, tanker flows, and model reliability agree with the move.

See the workflow

Turn market concepts into a repeatable workflow

The free guides explain what to watch. The Enerlytics platform helps track those signals, compare evidence, and avoid forcing a trade when the market has no edge.

See the workflow
Education plus workflow

Built for people who want to understand the move, not chase it.

Oil markets are noisy. A price move can start with a headline, but the real question is whether inventories, flows, spreads, equities, and model reliability confirm the story. Enerlytics combines free market education with paid workflow tools so users can learn what matters before relying on a signal.

Live global freight snapshot

See where physical crude movement is building or easing.

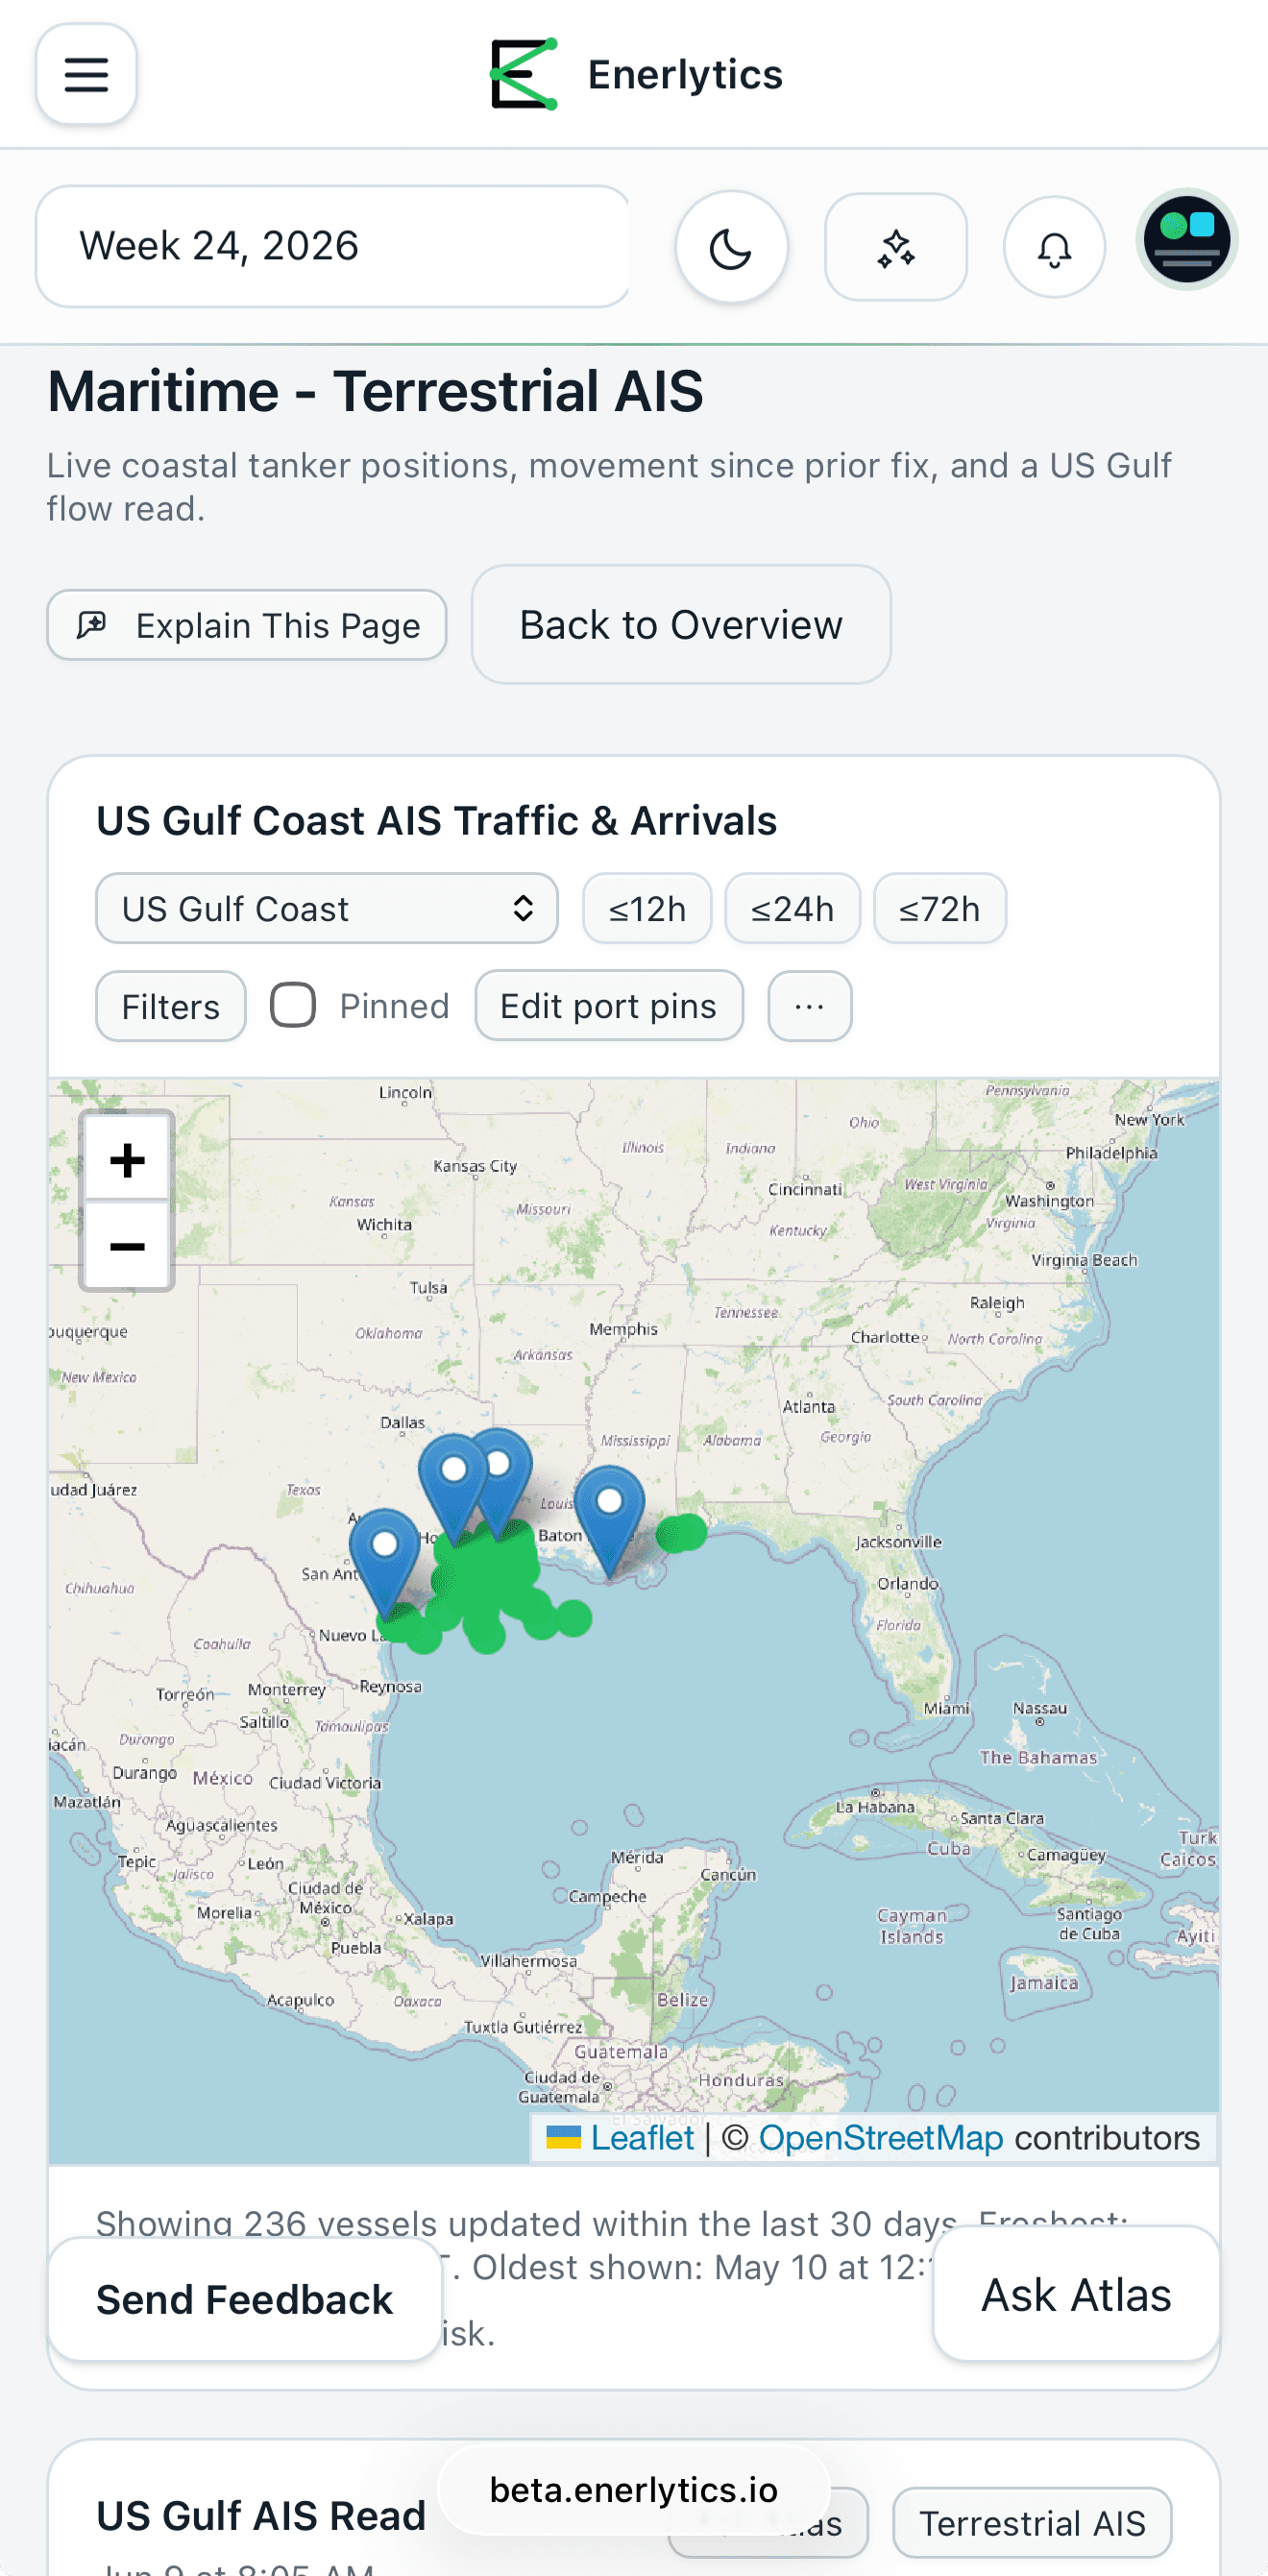
Explore terrestrial AIS activity across the US Gulf and major oil chokepoints, then ask the freight assistant what the latest vessel pattern may mean for flow pressure.

Terrestrial AIS · refreshed throughout the day
Live freight map loads as it approaches the viewport.
Freight AI Assistant
Live hints
Try a prompt:
Start trial for full AIS workflow

AIS supports directional flow analysis; destination strings and inferred cargo state remain estimates.

Signal accountability

Every signal leaves a record.

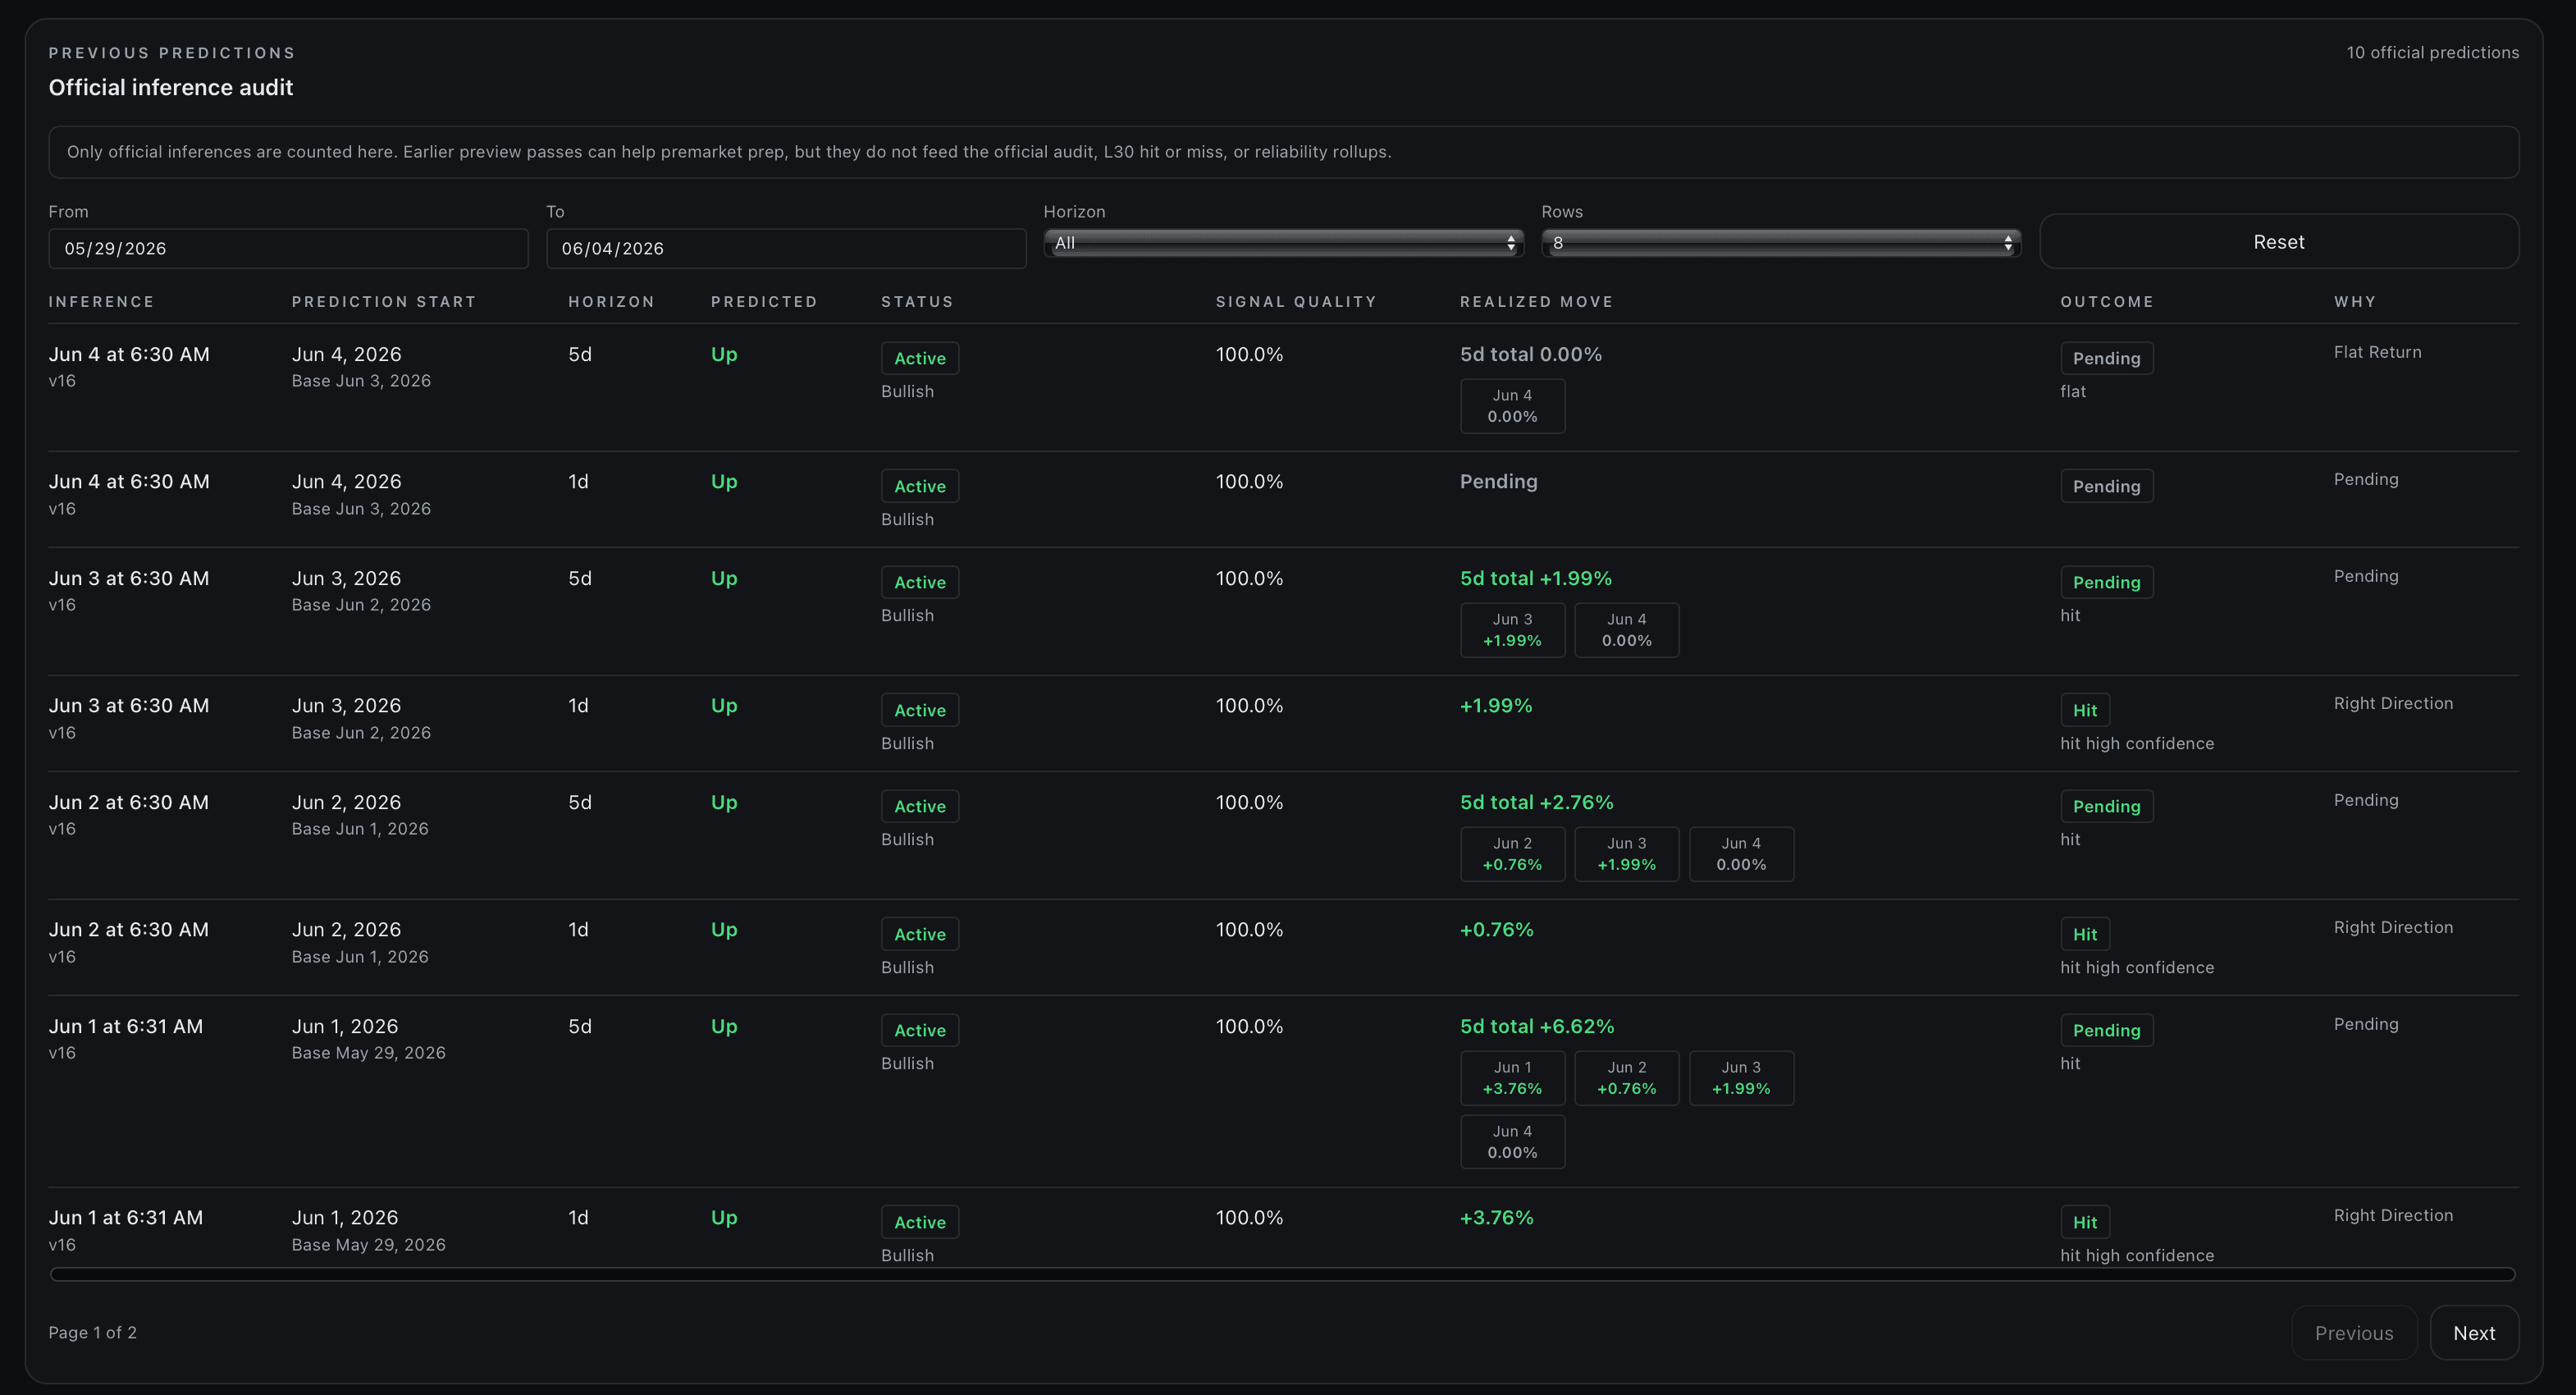
Enerlytics stores the original market state, confidence, drivers, and timestamp, then evaluates what happened after the forecast horizon.

Last 30 resolved
30

Brent Oil Fund (BNO) resolved window

1D hit rate
60%

Selected public example

5D hit rate
67%

Selected public example

Reliability adjustment
0%

Watchlist

Public track-record preview

Showing resolved examples for Brent Oil Fund (BNO). Full realized paths, drivers, and pending evaluations open inside the trial.

Start trial to open full audit
Oct 1, 6:30 AM
Miss
Horizon
1d
Signal
No Edge
Public detail
Resolved after horizon
Sep 30, 6:30 AM
Miss
Horizon
1d
Signal
No Edge
Public detail
Resolved after horizon
Sep 29, 6:30 AM
Hit
Horizon
1d
Signal
No Edge
Public detail
Resolved after horizon
Sep 25, 6:30 AM
Hit
Horizon
1d
Signal
No Edge
Public detail
Resolved after horizon
Sep 24, 6:30 AM
Hit
Horizon
5d
Signal
No Edge
Public detail
Resolved after horizon
Sep 22, 6:30 AM
Hit
Horizon
1d
Signal
No Edge
Public detail
Resolved after horizon
Public history only shows resolved hit/miss examples. A hit means the evaluated move finished in the predicted direction at the selected horizon. Historical signal performance does not guarantee future results. Enerlytics provides market intelligence, not individualized investment advice.
Example workflow

Headlines moved first. The physical market had to confirm.

Enerlytics keeps price, structure, inventories, flows, and the model read in one place so a crude rally does not get mistaken for confirmation before the underlying market agrees.

What price did
WTI -1.6%

$91.38 front-month, -1.6% on the day.

What structure said
Prompt curve is backwardation

The curve is moving, but not in a stable enough way yet to treat it as a clean structure confirmation signal.

What inventories showed
Commercial crude +0.9M bbl

Commercial U.S.

What visible flows showed
Visible flow proxy

Unavailable

What the model concluded
No Edge

BNO is No Edge over 1-5 days. The model is not forcing a bearish call because probabilities are too close. Watch for cleaner horizon alignment, stronger probability spread, better feature coverage, and market confirmation. This can be wrong and is not investment advice.
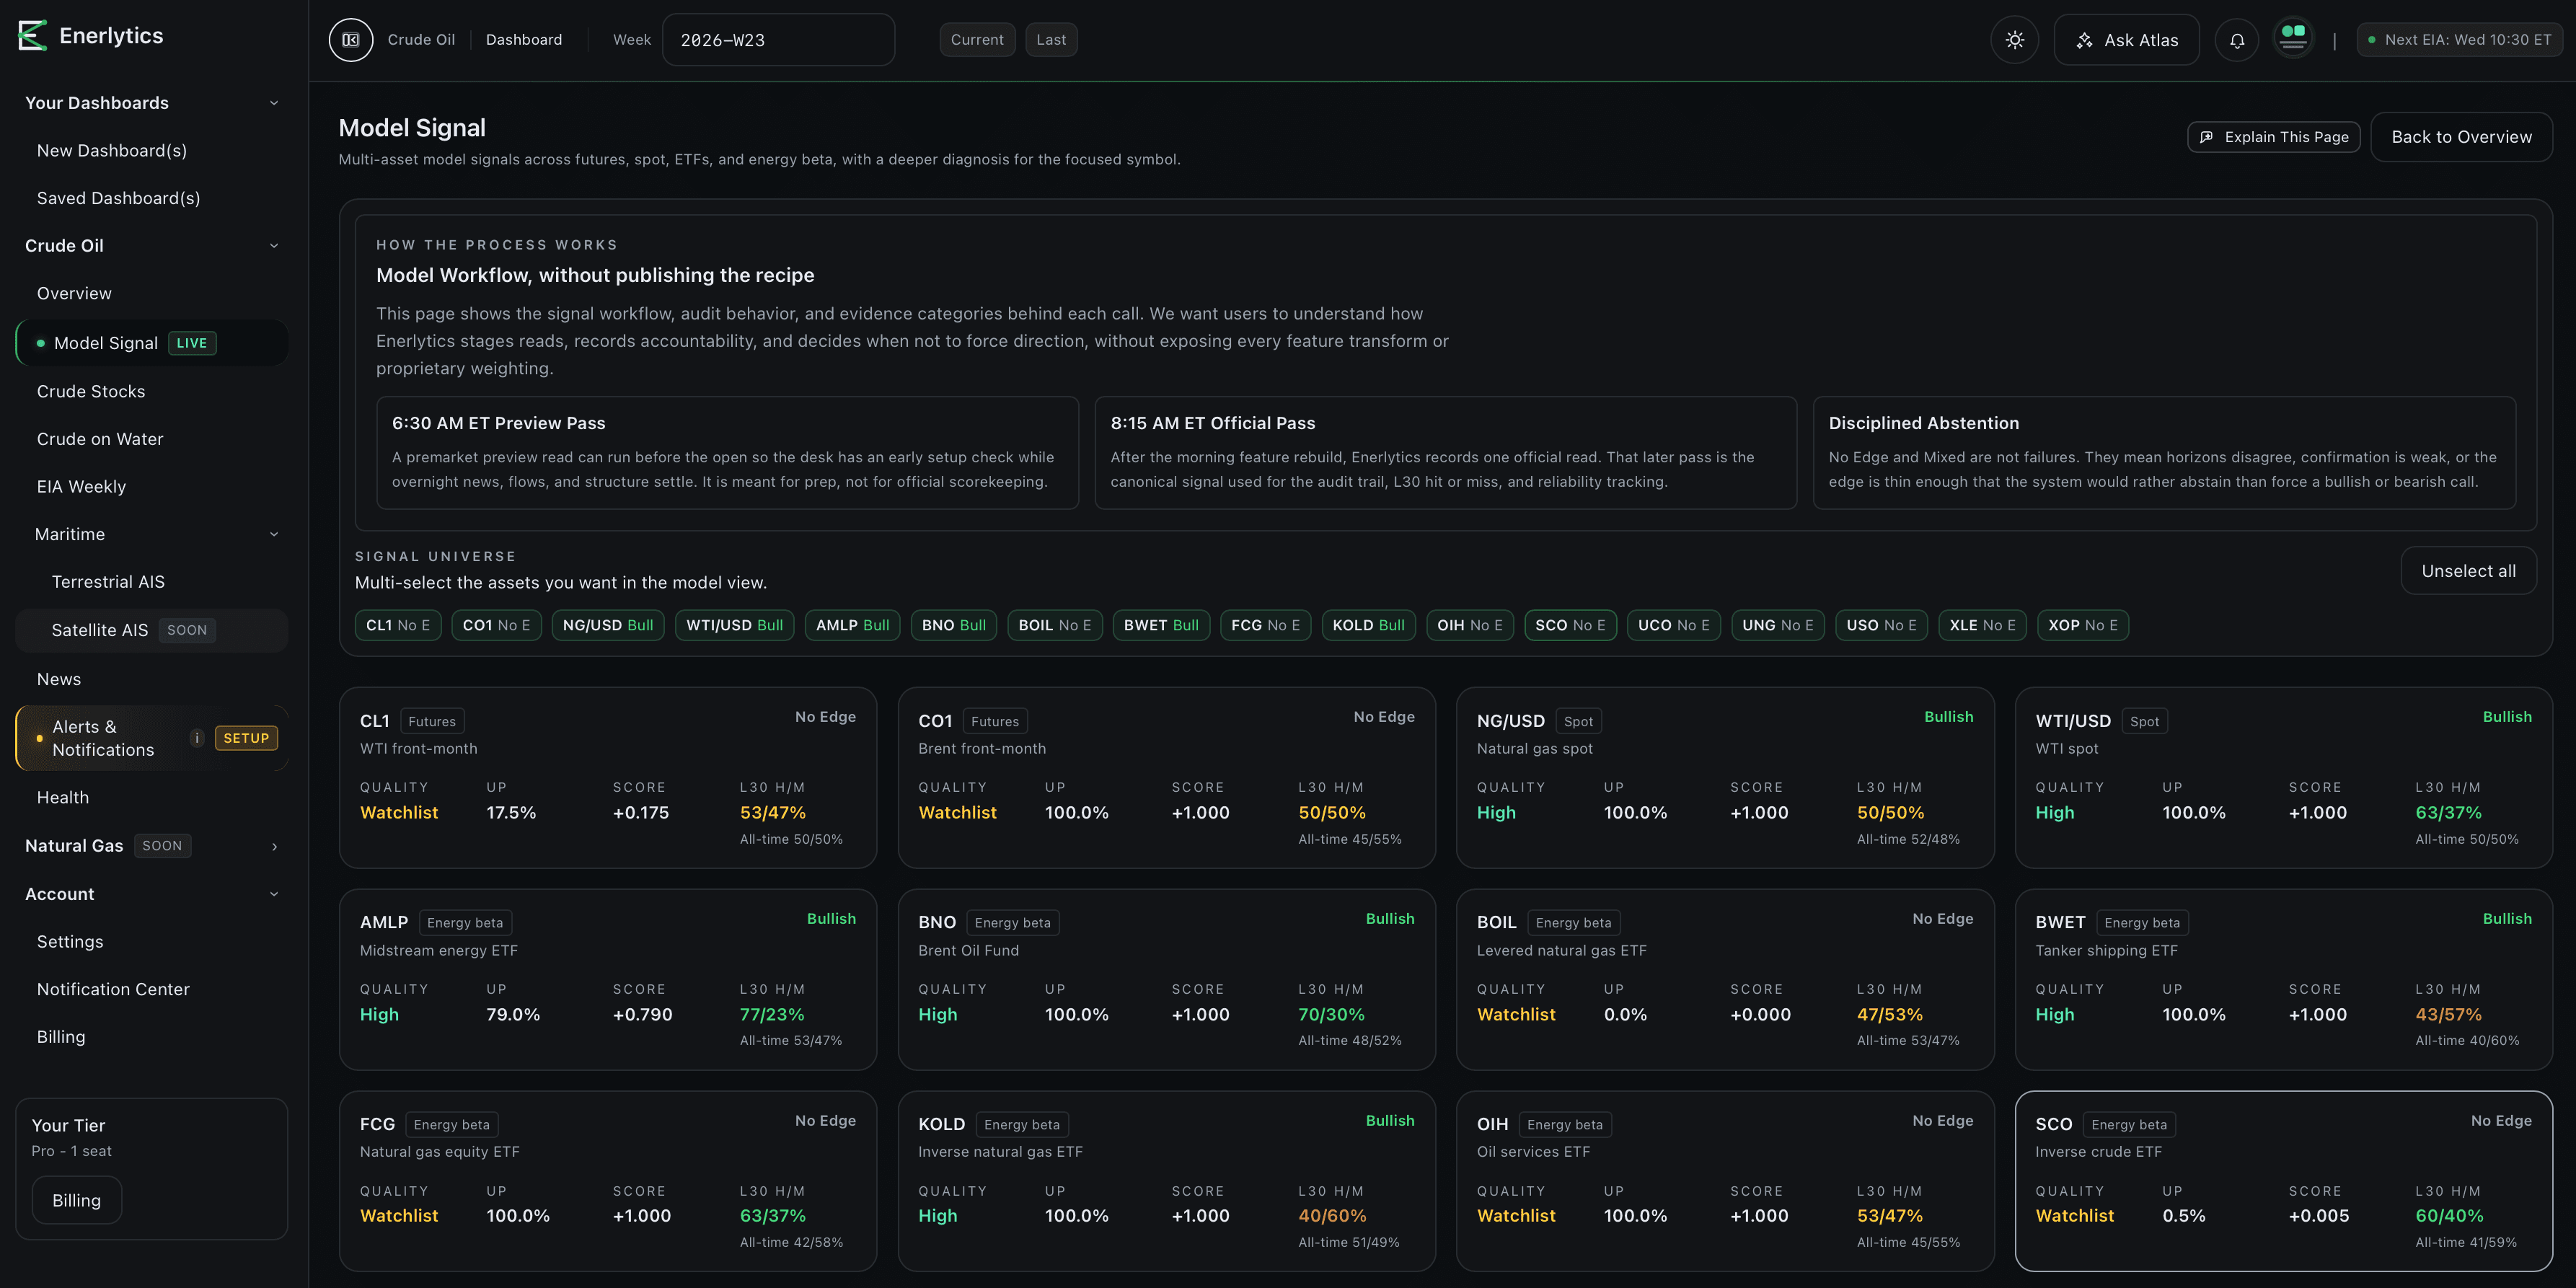
Enerlytics market pulse and signal workflow
Enerlytics signal audit and track record view
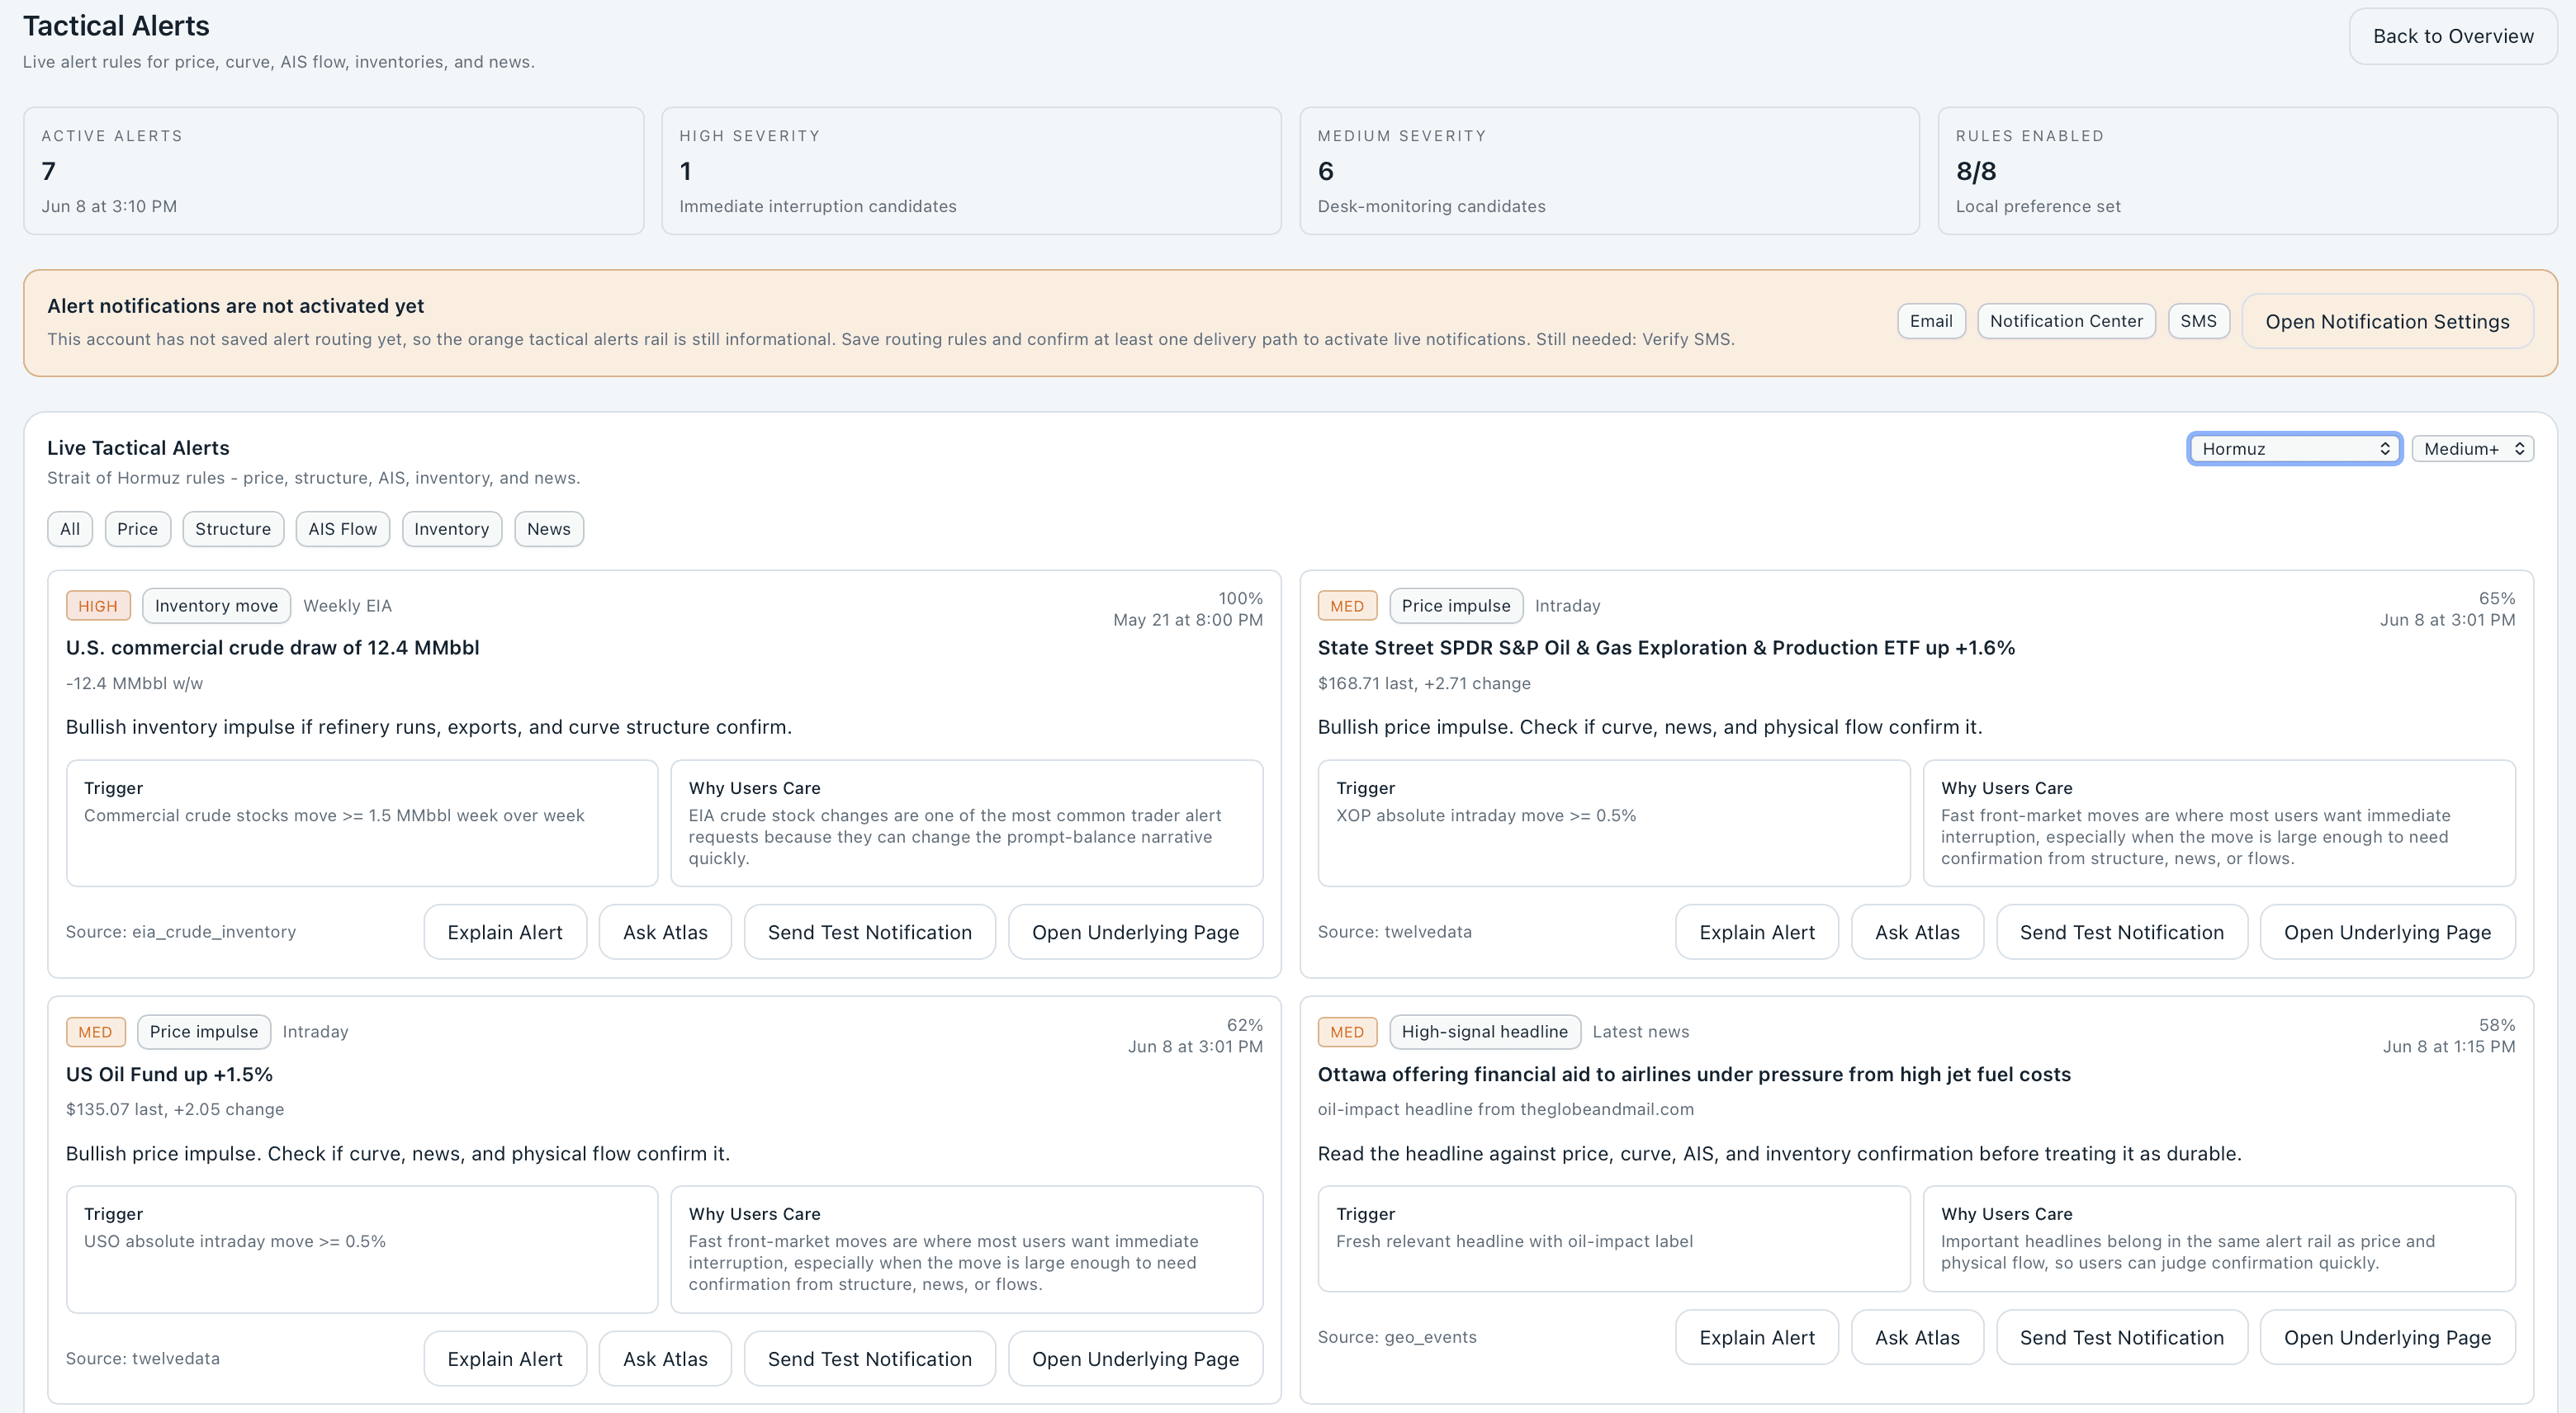
Enerlytics tactical alerts dashboard
Enerlytics mobile dashboard workflow
Mobile workflow
Alerts and mobile

Know when the evidence changes.

Alerts are tactical. They should tell you what changed, why it matters, and where to open next before the desk catches up.

WTI signal changes from No Edge to Bullish or Bullish to Mixed.
Commercial crude inventories swing enough to change the balance read.
Prompt structure strengthens or weakens far enough to matter for confirmation.
Visible tanker-flow pressure shifts and starts supporting or invalidating the move.
Live alert examples are loading.
Data coverage

One workflow across flows, inventories, spreads, price, and news.

Enerlytics is built for energy traders who want confirmation, not just another chart tab.

Price action
WTI $91.38

-1.6% vs prior settle.

Structure
backwardation

Watch whether inventory or visible-supply data starts pushing back against the curve.

Inventories
+0.9M bbl

Commercial U.S.

Visible flows
Crude-on-water proxy

Unavailable

Oil-impact news
-0.04

Headline direction is checked against article context so obvious supply restoration or disruption does not disappear into neutral noise.

Follow on X and Threads

Follow the market tape and the reasoning behind it.

X carries the faster chart and market cadence. Threads adds more conversational context around crude inventories, flows, model accountability, and what the evidence confirms.

Trial and pricing

Start free, then continue with the plan that matches your workflow.

Starter begins with a 30-day free trial and continues at $99/month. Pro and Team show the planned upgrade path for deeper alerts, history, exports, and shared workflows.

No trading guarantees, no black-box promises. Enerlytics is market intelligence and workflow support, not individualized investment advice.
Most popular
Starter
For traders who need daily crude context, explainable WTI and Brent reads, and signal accountability.
$99/month
30 days free, then $99/month. Cancel anytime.
  • 30-day free trial
  • Daily crude context and explainable signal states
  • Core signal accountability and market workflow
  • 1 custom dashboard
  • Up to 15 cards
  • Core crude oil insights (Cushing Δ, spreads, on-water, EIA weekly)
  • Weekly highlights email
  • Basic PNG/CSV export
Pro
For active crude traders who need tactical alerts, deeper flow data, and the full signal record.
$199/month
$159/mo effective on annual
  • Tactical alerts before or during material moves
  • Deeper flow data and full signal history
  • Unlimited dashboards
  • Unlimited cards
  • Advanced crude oil insights (attribution, intraday refresh)
  • Natural gas insights included
  • Email / Slack / SMS alerts
  • CSV & API export
  • Priority data refresh
  • Basic prebuilt templates
  • Email support
Team
For desks and organizations that need shared access, exports, and integration support.
$499/seat
$399/mo effective on annual
  • Shared market context and team workflows
  • Exports and integration support
  • Everything in Pro
  • Multi-seat collaboration
  • Seat management & roles
  • Shared templates
  • API & webhooks (full access)
  • Premium support with SLA
  • SAML/SSO & enterprise security
Start your trial

Built for traders who want confirmation before conviction.

New users can start a 30-day free trial here. Already have an account? Use the login button above to open the live platform.

Explainable crude-oil and natural-gas signal states: Bullish, Bearish, Mixed, and No Edge.
Signal history that shows what happened after the forecast horizon, not just the latest call.
Alerts tied to price, structure, inventories, storage, flows, weather, and market-impact news.
Start 30-day free trial

30 days free, then $99/month. Cancel anytime. Verify your email, then open the crude signal workflow.

30-day trial

By joining, you agree to receive product emails. Unsubscribe anytime.