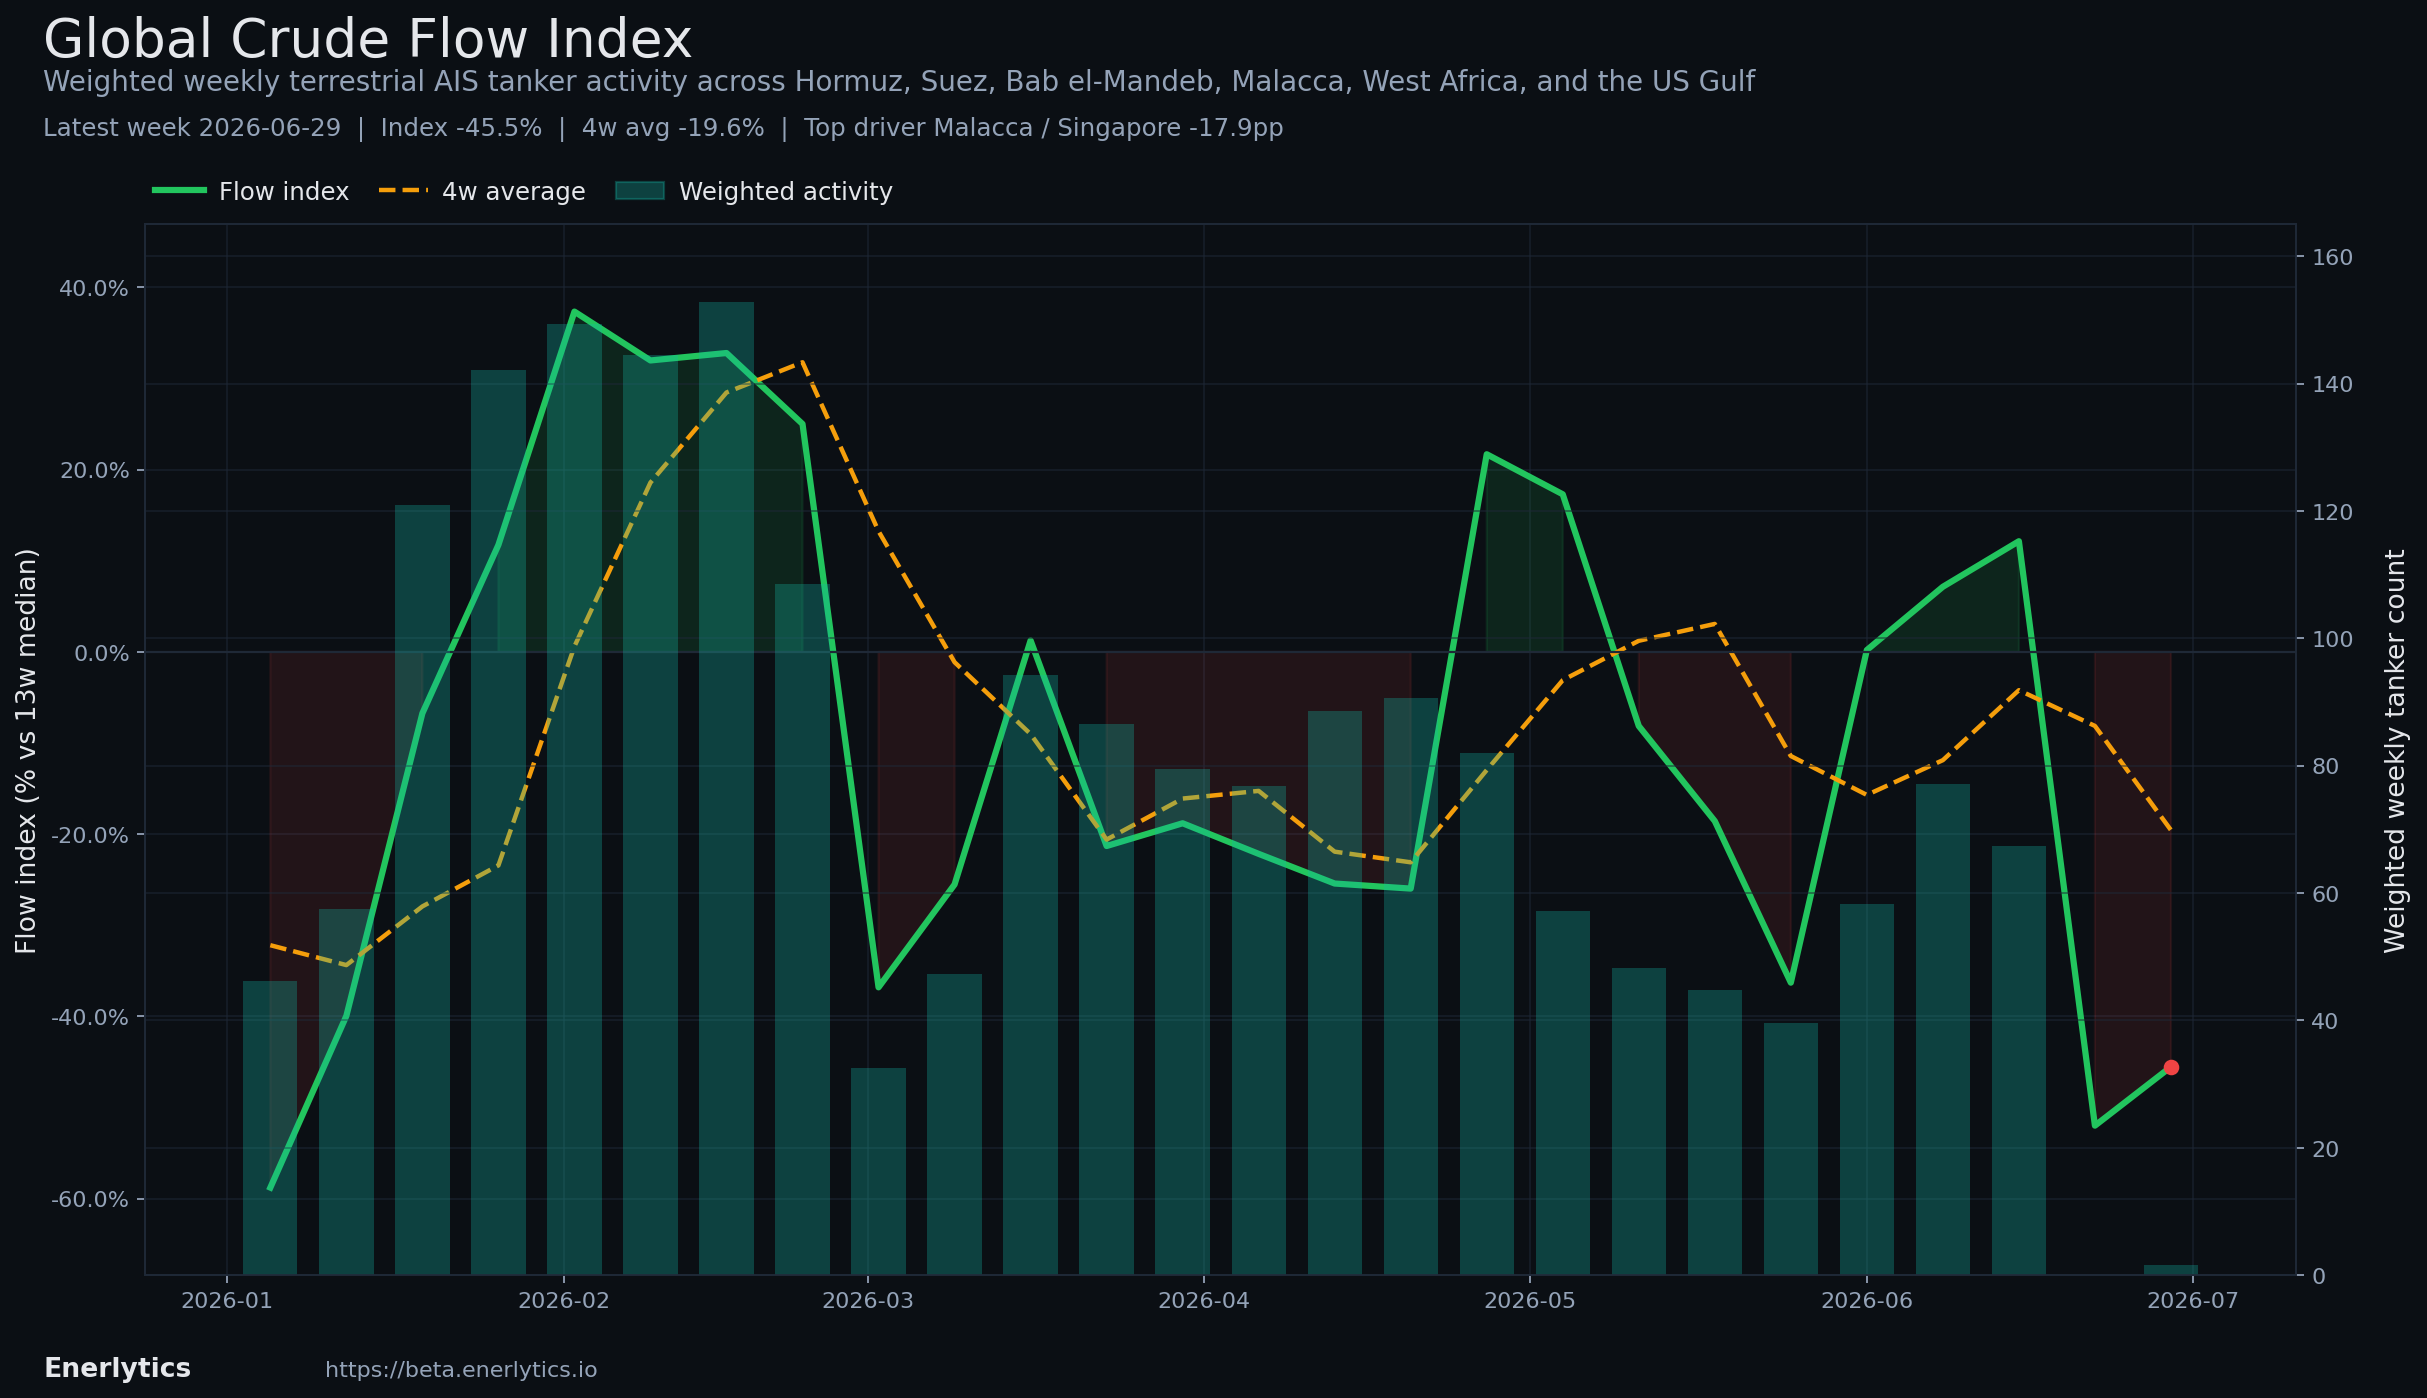
Observable crude flow is -45.5% versus its 13-week median.
In plain terms: This is an internal Enerlytics signal first. If it persists, it is the kind of setup that can feed later price or freight repricing.
Source post
Observable crude flow is -45.5% versus its 13-week median. 4-week average: -19.6% Weighted activity: 1.5 tankers Try the beta workflow ->
Follow-up context
In plain terms: This is an internal Enerlytics signal first. If it persists, it is the kind of setup that can feed later price or freight repricing.
Paths: Up if the next few sessions confirm this as a sustained flow change. Flat if the signal holds but only around the margin without broadening into a bigger regime shift....
More notes in the system
Saturday Research
Latest resolved crude calls went 0/2 right. Main miss was CL1 1d. CL1 1d MISS | Bearish 9% | +1.2% CL1 5d OPEN | Bearish 0% | n/a Get the deeper structure read ->
Saturday Research
Latest resolved crude calls went 1/2 right. Main miss was CL1 1d. CL1 1d MISS | Bullish 58% | -1.2% CL1 5d OPEN | Bearish 0% | n/a Get the deeper structure read ->
CL1 -3.1% on the latest session.
CL1 -3.1% on the latest session to $77.72. Same-session ETFs: USO +0.0% | BNO +0.0% Same-session equities: XLE +0.0% | XOP +0.0% What this means: Futures moved first; now flows, inventories, and oil beta need to confirm it.